Understanding Your Analytics Dashboard
What every metric and breakdown means
Written By David
Last updated 2 days ago
Your dashboard is home base for Web Analytics, the numbers that matter, with the previous period shown next to the current one so trends jump straight out.
Top metrics
Visitors: unique people who visited.
Conversions: sessions that completed a conversion (see Setting Up Conversions).
Page Views: total pages loaded.
Avg. Visit Time: average time on site per session.
Bounce Rate: share of single-page sessions.
Conversion Rate: conversions divided by visitors. In revenue mode you also see Total revenue and Avg. Rev / Visitor (revenue divided by visitors).
Revenue (when Revenue is your conversion metric), with the chart splitting new revenue, renewals and refunds.

Breakdowns
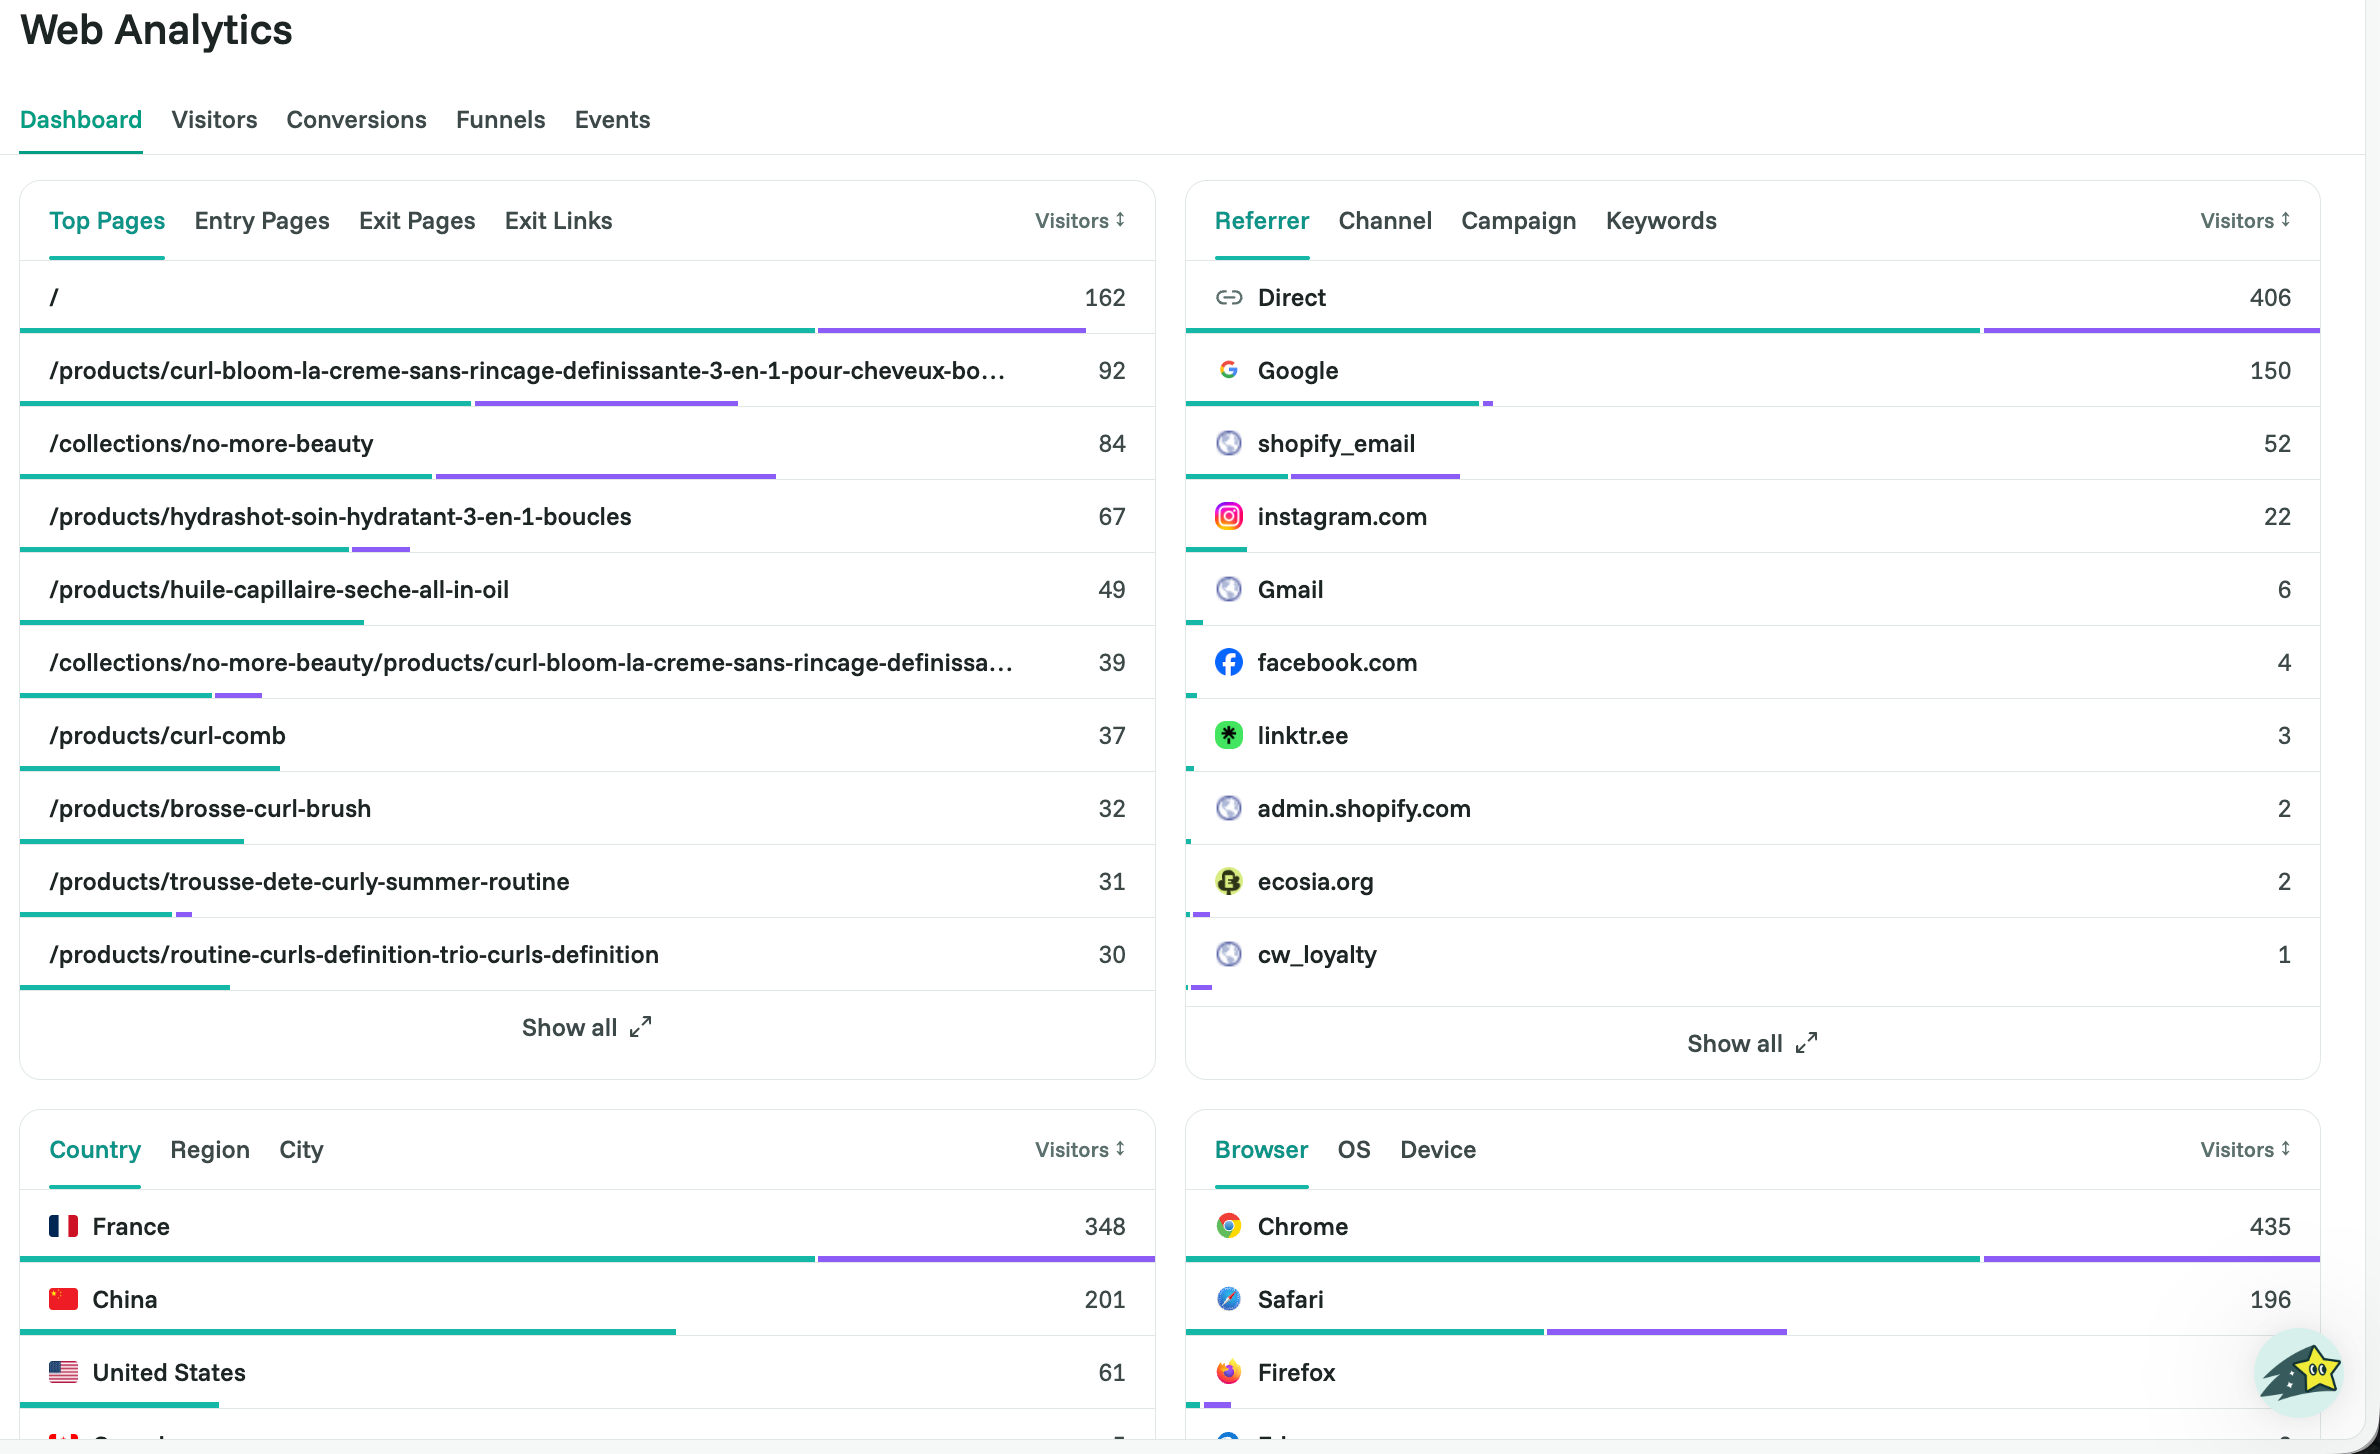
Below the chart, each dimension has its own card. Click a tab to switch the view:
Pages: Top, Entry, and Exit pages, plus Exit Links (where people leave).
Sources: Referrer, Channel, Campaign, and Keywords.
Locations: Country, Region, City.
Technology: Browser, OS, Device.
Change the time range
Use the date filter (top right) to switch periods: last 7 days, 30 days, or a custom range. Every metric and breakdown updates, and the period-over-period comparison adjusts with it. Free plans can view the last 12 months; paid plans up to 5 years.
Go deeper
Open the Visitors tab and use Filter to combine dimensions, for example mobile visitors from Google in France.
Shared Links tab (Pro and above)
On Pro and above, the Shared Links tab lets you share a read-only copy of the dashboard, with an optional password and expiry date.
Related articles
Was this helpful?
Still need help? Ask the team